
Online advertising platforms, including Google and Facebook, make it incredibly easy to track and measure ad performance.
We know how many times an ad was shown. How many people clicked on it. How those people engage with the landing page. And, finally, how many visitors converted into leads.
That’s just the surface.
With such a wealth of data, this is one of the channels that are easiest to report on so that you can make quick adjustments to maximize profit.
The sheer volume of data also makes it hard to know what’s important.
Consider this article your guide through the numbers that are most important and relevant to your business’ bottom line. It will teach you how to read and interpret them so that you can make the best business decisions.
Conversions, Conversion Rate, and Cost Per Acquisition
 A ‘conversion’ refers to a website visitor who took some type of action, like filling out a contact form or calling your phone number, that classifies them as a lead. A lead is someone who’s interested in the services or products that you offer, expressed their interest by taking pre-defined conversion actions, and represents an opportunity for your business to earn revenue.
The ‘conversion rate’ is the ratio of conversions to total traffic. If 100 people clicked on an ad and 5 converted, that’s a conversion rate of 5%. Your conversion rate is important because higher conversion rates can help reduce cost per acquisition, either because the landing page pitch is more effective or because the traffic to the landing page is more relevant. In both cases, you are spending less money on “duds.” The overall baseline for conversion rates is 3–4%.
Different PPC agencies define conversions in different ways. Lead quality matters and some agencies will “water down” the definition to inflate the numbers. I, and Now Media Group, strictly define a conversion as a clear business opportunity. Know your agency’s definitions, it matters when reading the numbers.
We’ll come back to this, first let’s quickly delve into ‘cost per acquisition.’
Cost per acquisition (CPA) and cost per lead (CPL) are synonymous. When reported to you, it’s typically an average, or total cost divided by total leads. CPA is the direct advertising cost you paid to acquire that lead.
What’s a good CPA? The cheaper the better, but some leads are always going to be relatively expensive. There are historical and industry baselines you can look at to gauge whether the CPA is too high. The best way to judge CPA is to compare it against the expected revenue the lead will bring in. Because of the way online ad platforms work, your advertising campaigns should be organized well enough for you to know what product or service the lead is interested in.
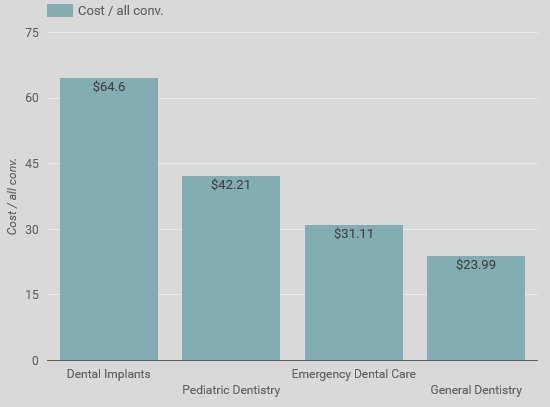
Here’s what the data, organized by product or service, looks like in our own client-facing reports:

In the above case, the practice probably offers a specific implant-supported bridge protocol or product. The breakdown is so specific because that is best practice regarding account organization. Granularity is important for making investment decisions. If you don’t offer Teeth Next Day and you’re advertising for their terms to steal business away, having the cost per acquisition for those leads can tell you whether it’s a profitable business decision.
If you are running ads for more services, that breakdown would include “general dentistry,” “cosmetic dentistry,” and other service areas with common key terms where relevant ads show up.
For example:
The best standard to judge a CPA will always be your own, or how does the CPA compare to the historic baseline and how does it compare to the expected lifetime customer value?
Suppose that 1 out of 3 Google ads leads become actual patients. Your cost per patient is the CPA multiplied by 3. In other words, if one out of three dental implant leads produce value, multiply the CPA for dental implant leads by three – this is what it cost to acquire an actual patient from Google ads. Now you can compare this number to the expected customer lifetime value.
Customer lifetime value is a metric that can only be determined using your own data. One easy proxy metric is to take total patient/customer review for a year and divide it by total patients/customers, giving you average annual spend per capita. I’m surprised how many practices don’t track this number. I highly recommend that you do because it will help you better allocate advertising spending across the various marketing channels, like social media, search engine optimization, and paid advertising.
If the CPA is less than the expected customer lifetime value, the investment is profitable and has room to grow. You can compare these numbers across different advertising investments, and within your paid advertising specifically, to determine opportunity costs.
Coming back to the earlier discussion on conversions and definitions, the need for accurate business decisions is why it’s important to know the quality of the leads and their true value, which is why you should get precise definitions from your agency. If they measure conversions by some weak definition (like “people who have visited two or more pages on your website”), it will inflate your conversions, conversion rates, and misreport cost per acquisition. The standard to work toward is a 1-to-1 ratio between conversions and actual patients. There will always be a discrepancy, but the 1-to-1 ratio is the ideal and should be the perpetual goal of the ad account manager. Their definition of a ‘conversion’ must reflect this goal.
Search Lost Impression Share: Budget and Rank
[optin-monster-shortcode id=”wbw80mm0fxs0v0dhpgku”]Ad platforms want you to spend more money and most have metrics to measure how many opportunities you’re missing out on because of the size of your budget. Google Ads measure this with the metric ‘Search Lost Impression Share (Budget)’ or ‘Search Lost IS (Budget).’ This metric, like most, can be broken down by service area and/or product.
Suppose your Search Lost IS (Budget) is 70%. That means you are missing out on 70% of all the opportunities your ad could have shown because of a lack of a high enough budget. It’s a seemingly powerful metric because, naturally, you’ll always prefer to show your ad more often than less often. On its own, though, it’s not enough information to guide your investment decisions.
If your cost per acquisition is too high, then it doesn’t make sense to increase spend in that area, no matter how many impressions you’re losing out on. Clearly, those impressions aren’t worth the cost. Likewise, two service areas may both be suffering from high search lost IS (budget) and, if you have an overall budget constraint (as most of us do), you’ll want to focus on the area with the highest ROI.
There also may be lower hanging fruit you can capitalize on without having to increase your budget. If your agency shows you Search Lost IS (Budget), ask them to see Search Lost IS (Rank). Search Lost IS (Rank) tells us how many impressions the ad lost out on because AdRank is low.
What’s AdRank? AdRank is a proxy metric that Google uses to measure the overall relevance of your ad campaign to the audience you’re targeting. Each keyword you bid on has an AdRank determined as a function of the ad copy, the landing page copy, and the expected click-through rate. The tighter and more relevant all these different factors are, the higher the AdRank. Google rewards relevancy. The higher the AdRank, the less you must spend to attain top positioning on Google with your ads. If there’s room to improve AdRank, your agency can improve your campaign’s performance without spending money.
Perfect quality scores across the board are tough (but possible) and you shouldn’t hold your agency to an impossible standard but Search Lost IS (Rank) is a great proxy metric to get an idea of how your Google ad account is being managed.
Click-Through Rates and Other Metrics
Click-through rate (CTR) is the ratio of clicks to total times the ad was viewed. If your ad was shown 100 times and it earned 10 clicks, that’s a CTR of 10%. This metric is far removed from your bottom line and used to measure how effective the ad is in attracting traffic to your landing page. A general baseline for a good CTR is 2% on average.
If a click-through rate is too low, it typically means that the ad simply isn’t compelling — it’s not attracting clicks — or the ad is showing to an irrelevant audience. People aren’t going to click on a dental implants ad if they’re looking to book an oral hygiene appointment.
Because the metric is so far removed from the bottom line and is more useful to the specialist making day-to-day optimization decisions, I typically don’t share click-through rates in reports. It’s captured and weighed in a much more useful, global way by AdRank and Search Lost IS (Rank). However, you may want to see it just to be able to track how well your ad campaign is being managed.
There are other metrics that are extremely important but more so for the manager or specialist.
For example, cost per click (CPC) is an important metric, but not one you can make overall business decisions on. The ad specialist will always focus on minimizing CPC, but what matters more for you is CPA (cost per acquisition). The cost of the lead is more important than the cost of the click since the cost of the lead is what most immediately factors into your investment allocation decisions. Also, consider that a higher CPC might signal greater relevancy; paying $1 per click for “dental implants cost” and $3 for “dental implants” is worth it if “dental implants” is 3x+ as likely to convert.
Specialists also like to break data down by browser and device type, because it helps bring attention to possible technical problems. If a campaign converts better on Chrome than it does on Internet Explorer, it might mean that the landing page does not render well on Internet Explorer. Fixing that issue can increase your conversion rates without requiring you to spend more money. Again, these are technical metrics that are more remote from your bottom line. They do play into the return on your ad spend, but they are numbers that are more useful to your agency.
Using metrics like conversion rates by device type or cost per acquisition by device type, your ad specialist can instruct Google to prioritize spend toward customers you know are likelier to buy. They can do the same for location, and even age and gender. These metrics are undoubtedly useful, but they are granular and most useful to the specialist who’s optimizing the campaign. You must be able to trust that your agency is using these metrics to improve their allocation of your investment so that you can focus on the big picture.
TL;DR (The Point in a Nutshell)
 If you are the business owner, there are five main Google ad metrics that concern you:
- Conversions: The total number of leads generated by the campaign over a period.
- Conversion rate: The percentage of website visitors who turned into leads.
- Cost per acquisition/lead: The average cost to acquire each lead.
- Search lost impression share (budget): The percentage of times your ad is not showing because of a lack of sufficient budget.
- Search lost impression share (rank): The percentage of times your ad is not showing because the account must be further optimized.
Cost per acquisition is your key metric. As long as it’s lower than the average customer lifetime value, your investment in paid advertising is producing a positive ROI.
Search lost impression share (budget) can be used to guide you toward new investment opportunities. Wouldn’t you like to show the ad as often as possible? Be careful, because the interpretation is not straightforward. Base your decision on cost per acquisition; search loss impression share (budget) is just a guide for how much room you have to grow the budget, if and only if you’re earning a positive ROI and other investment opportunities produce lower returns.
If your agency shows you search loss impression share (budget) then ask to see search loss impression share (rank). The latter is a measure of how many more times your ad would be shown if it was better optimized, and therefore serves as a proxy of how well your account is being managed.
There are dozens, if not hundreds, of other metrics collected by Google. Most of these are useful to the person optimizing the account but can distract the business owner from what matters at the higher level: does the investment in Google ads make fiscal sense?