Successful content marketing is all about strategy. It’s about harmonizing business goals with customer interests. Your content — whether a page on your website, a blog, a newsletter, et cetera — needs to have direction, and that direction should be informed by your understanding of what your customers want to read or hear. The way to do this is by building a buyer persona, or a character sheet, which organizes all the information you have on what your average customer looks like.
Last week, I attended a marketing event where Julien Brandt and Samantha Kerstetter, of OrganikSEO, gave a great talk on how to amplify your content for SEO. During the question and answer session, someone in the audience asked how they could go about building a persona from scratch. There wasn’t really a strong answer, so I want to share some insight on how do just that at Now Media Group.
You might have noticed the [wonkish] tag in the title. Parts of this post will be somewhat technical, so bear with me.
Google Analytics to the Rescue
If you have Google Analytics installed on your website — if you don’t, install it now —, you have access to demographics data. Demographics reporting is not turned on by default, but switching it on is easy — it takes about three steps, which I’ve outlined in a footer below (go there now).
Before talking about what kind of information Analytics’ demographics data provides, first we need to talk statistics.
By default, your reporting will be set to all of your traffic, excluding any filters you’ve set. This is usually no good, because all traffic includes people who aren’t true customers, prospective or otherwise. A couple examples of why this might be the case:
- Your ads or current content aren’t attracting the right kind of people. Instead, you’re bringing traffic that isn’t really interested in your product. It happens; it’s what building a persona helps to remedy.
- A lot of the sessions to your website are your own, or other employees’. This is something you can filter out, but filtering can be imperfect (especially because of user error — like, not accounting for a dynamic IP).
The point is, you want to narrow down your data set to the traffic most likely to buy from you. You do this through segmentation — for a guide on what this is and how to do it, see “Using Segmentation to Improve Your Analytics Reports.”
There are a couple of ready-made segments that help eliminate some of the irrelevant data points in your report: non-bounce sessions and multi-session users. Non-bounce sessions are visitors to your website who visited two or more pages. Multi-session users are people who have visited your website more than once. The reason I highlight these two segments is because they are better measures of traffic that engaged with your content. If someone is looking at multiple blogs, or multiple pages, or if they’re returning often, it means there’s something on your website that they like.
If you’re savvy with Google Analytics, you can go one step further and look at only traffic that has converted. These are people who have actually gone to your website and bought something, or have you given you a call, or have downloaded your white paper. You can do this through goal tracking, and then you can segment your data to those who meet these goals. If you do it this way, you’ll have a much more accurate idea of who your true customers are.
If you don’t have goal tracking set up, then segment by non-bounce or multi-session users.
What Can I Do With Google Analytics’ Demographics Data?
Once you segment your data, you can look at your demographics information. The relevant reports are the ones boxed in orange below. You’ll also see two sets of graphs, one for multi-session users and the other for non-bounce sessions — notice the differences in what the data reports. It goes to show that choosing the right segment matters. Anyways, this is what it looks like on your Analytics dashboard:
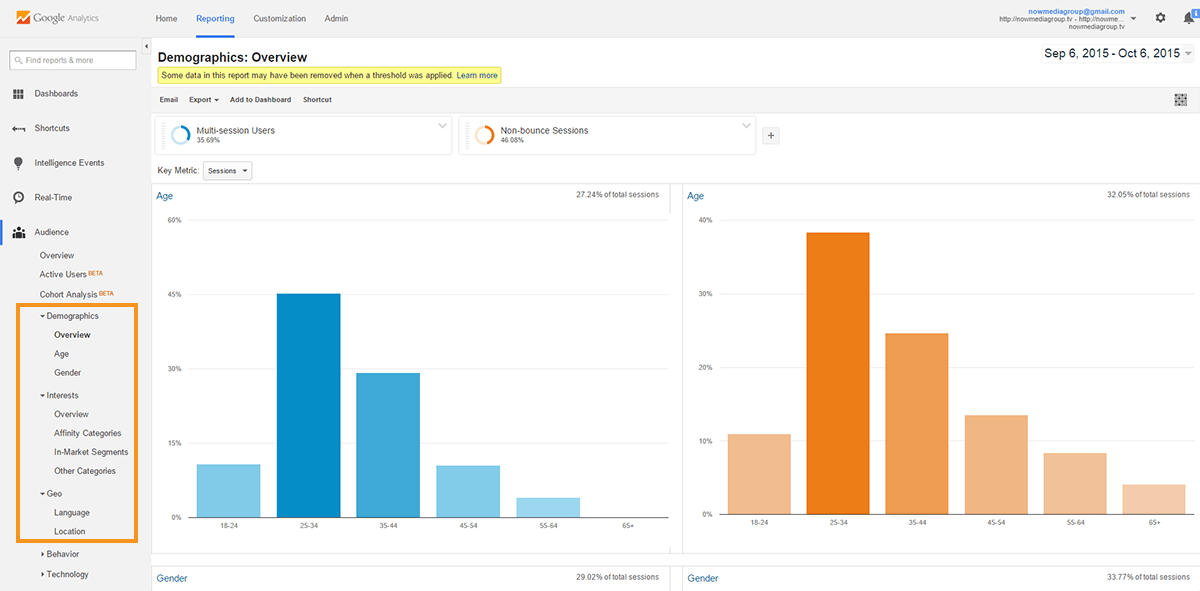
From these reports, you can get the gender and age breakdowns, and you can even see where your buyers are coming from.
You’ll notice that, if you go deeper into the age and gender reports, you’ll see that Analytics will break down their behavior for you and provide goal tracking data. These features are there to help pinpoint weaknesses in your marketing strategy. It goes to show that the best data for completing your persona should be segmented for conversions, but if you don’t have any goals set up, we have to work with a second-best solution.
Finally, under Interests, you’ll see two main reports: Affinity Categories and In-Market Segments. Affinity Categories give you information on what other things your readers are interested in. Common categories you’ll see are “TV Lovers,” “Technophiles,” “Music Lovers,” and other categories along those really broad lines. I mean, who isn’t a music lover, right? More seriously, affinity categories will help you figure out in what terms or context you should couch your content to appeal to your audience. If you have especially technical content, this will prove useful, because you can make your blogs and your pages more interesting — more interesting means more likely to be shared and linked to.
In-Market Segments provide information on what kind of products your visitors are currently researching. Google compiles this data from ad clicks and by tracking other websites your visitors are going to. Suppose that 15 percent of users are currently looking into “Motor Vehicles” (one of the in-market segments) and you’re a local business who sells cars or auto parts. These are people who are most likely nearing the end of the conversion process, which means that they’re getting ready to make their purchasing decision. You can build a persona around these visitors and implement a content strategy to attract them, so that, when they finally decide to buy what they’re looking for, they choose your business.
Google Analytics provides quite a bit of information on your website visits, and this data can help provide some basic insight on your persona, or the average person your website content is targeting. Just on the surface, it can give you the most basic insights: gender, age range, hobbies, and shopping patterns. And I encourage you to dig deeper into these statistics, because Google Analytics is one of those things where the more you think about it, the more you play around with, the more you can get out of it.
For example, you can look exclusively at non-bounce users from Facebook and you can use this information to optimize your content strategy for Facebook. You can do the same for any channel, or source of traffic. By playing with your data you can build more specific personas for different sources of traffic and you can design a multi-layer content strategy that will do a better job at attracting potential customers at different stages of the buying process.
I Have No Analytics…So?
If you or your client don’t have Google Analytics, put it on the website now. You won’t get retroactive data, but you can take a month to collect data and use that to build a persona, or improve an existing one.
In the meantime, what else can you do? Intuition is better than nothing, but intuition is fallible. You want some sort of evidence, or data, to back up your assumptions. One option is to analyze your Facebook following. If you manage the page, your screen will look something like this:
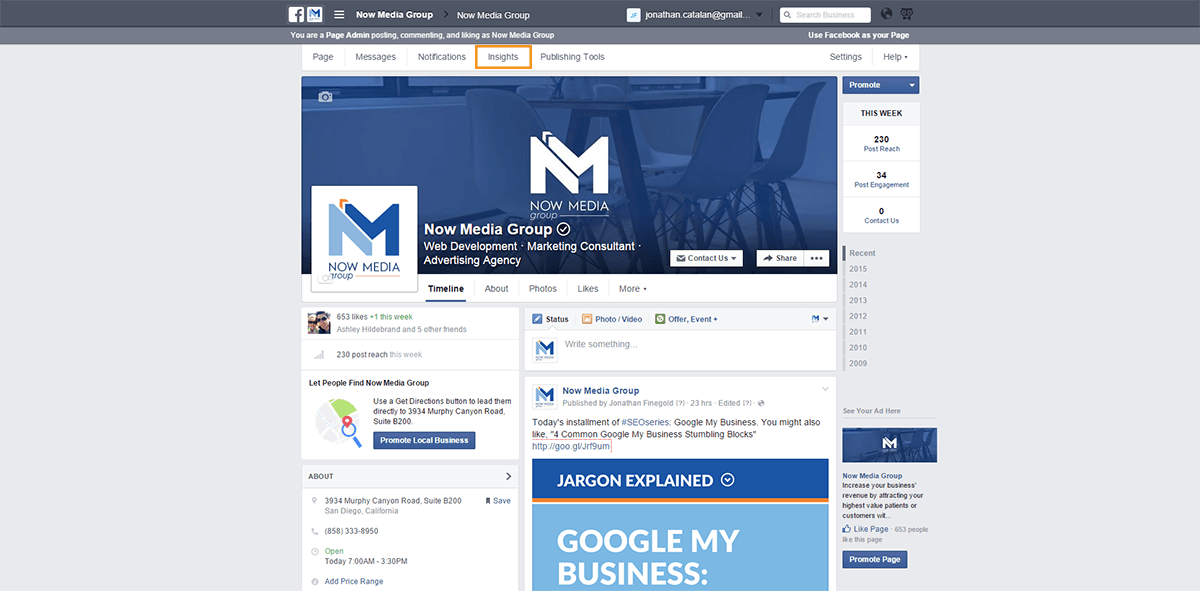
If you look towards the top, you’ll see an orange box (which I added) around a link that reads “Insights.” Go ahead and click on that. It will take you to an overview page. Near the top, where “Insights” is, you’ll see a link below it that reads “People.” This report will give you some basic demographic insights on your fan base and the people your Facebook posts have reached: gender, age ranges, their location, and the languages they speak. The “people reached” segment will be more useful to you, because it speaks more to people who are engaging with your business.
As Facebook’s privacy settings get stricter and stricter, it’ll be harder and harder to directly analyze your fan base. Nowadays, businesses usually can’t even see who the individual people liking their page are. If you are able to, one tactic is to build an Excel spreadsheet and start to record basic information on your fans: age, gender, interests, income level, et cetera. This process is clearly labor-intensive and, in an age of growing privacy concerns, questionable, but it can provide great insight and, in the end, it’s essentially what Google Analytics and other data mining services do.
Another option is to conduct customer surveys. You can reach out to existing customers by email, or you can include a survey with one or two questions on your website. In the latter case, you can make them fill out the survey in order to see past a certain point in your content — although, this can increase your bounce rate — or you can have it pop up when they try to leave the site. These tactics can annoy your users, so use them selectively and make the surveys easy to answer. While you may only be able to ask one or two questions at a time, you can periodically cycle through the questions and slowly build your database.
One way to make the survey more appealing to answer is by wrapping the survey within the context of product feedback, where the customer can also make comments on how to improve the product and the business. You can also use incentives to make survey answers more likely (and to appease the people who hate answering surveys), like, “Answer and we’ll send you an email with a 5–10% off coupon.”
Hubspot shares a lot of great knowledge on how to build buyer personas on survey data (they also have a lot of great information on pretty much everything else marketing related), so I definitely recommend checking them out. And, in the end, your customers are the best source of information, so survey data is often considered the source of data for buyer personas, using analytics to start with and to inform your content strategy as you go.
We Want to Hear Your Insight
Do you have another way of building your personas? Inversely, do you have a question on building your persona? If so, please share what you’re thinking in the comments below!
If you liked this article, you may also enjoy “Is it Time For New Content?” Now Media Group is interested in learning about you and your business. Contact us to talk about how we can help your business grow.
_______________________________
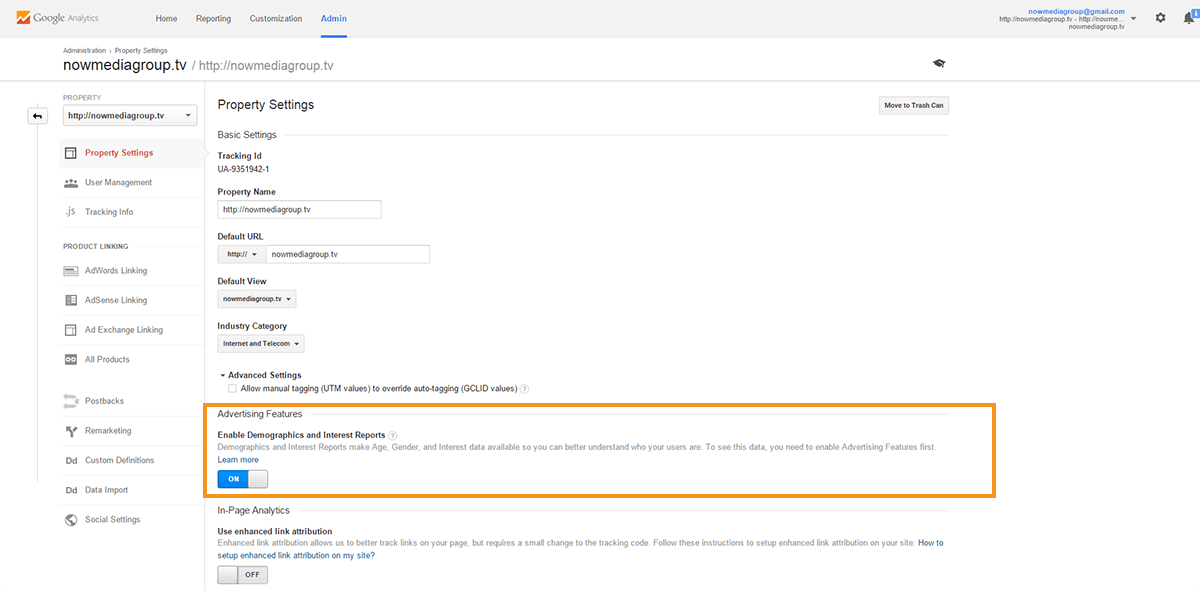
How to Turn Demographics Reporting on Google Analytics
When you log in to your Analytics, you should see something like this:

When you click on Admin, it will take you to this screen:
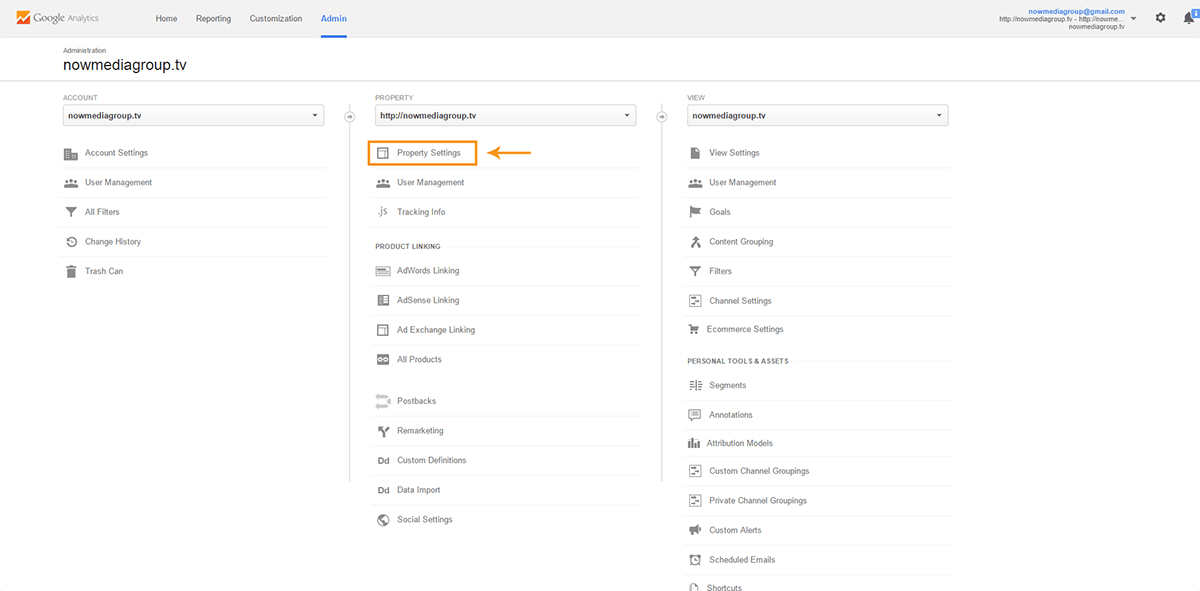
Hit Property Settings, and that’s where you’ll enable demographics and interests reporting, as illustrated here: